
Often as part of an incident response engagement you will find yourself looking at logs for analysis purposes. We really like Splunk for ad-hoc log analysis, it has a really powerful query language and lots of support for logs. And if you’re reading this and you’re thinking, but I don’t have a Splunk license, don’t worry there is something called Splunk Free. It can be useful for some basic testing and daily ingestion of 500MB worth of logs. If you’re planning to use Splunk in your enterprise environment a free license is not advised, because its features are limited.
Now back to the promise, set up your log analysis environment in 15 minutes. We’ll show you how in this blog post that covers:
- Configure a Windows virtual machine in Google Cloud with Splunk
- Upload your evidence to your Splunk machine for further processing and analysis
- (Optional) Connect your instance to a custom domain and install a certificate with Letsencrypt
Step 1 — Install Windows and Splunk
The reason for picking Windows as the base operating system is that it is required for the analysis of local Windows Event Logs.
The Splunk universal forwarder or Splunk Enterprise instance must run on Windows. See Install on Windows in the Installation Manual.
- First we login on GCP (https://console.cloud.google.com)
- In the menu on the left-hand side select Compute Engine and next VM instances
- Configure machine type, for basic ad-hoc workloads select e2-standard-4
- Configure boot disk, select Windows Server with one of the recent versions with the Desktop Experience enabled. Configuring Splunk without the GUI in this setup can be a pain.
- Setup an external IP address for your Splunk machine.
Virtual machine configuration
The configuration depends on personal preference, budget and how you want to use the machine. The idea is that you only need to perform short ad-hoc tasks with some basic compute power. If you need high-performance you can make different choice such as a SSD disk or more CPUs.
Now that we have a Windows server up and running it’s time to install Splunk.
- Connect to the server, this is out of scope for this blog, but we trust you’ll be able to successfully connect through RDP to the machine.
- Open a browser and go to https://www.splunk.com/en_us/download/splunk-enterprise.html
- After logging in, select Windows and then the .MSI file for Windows
- Install the executable and open up Splunk
The above steps are pretty straightforward you should know have Splunk running on a Windows server in GCP ready to use. We’ll do some additional configuration:
- Enable HTTPS on Splunk on port 443
- Allow incoming traffic on port 443 in the Windows Firewall
Now we’re able to connect to our public IP and access Splunk. At this stage there is no valid certificate so you’ll get a lot of warnings, but it works. In the last part of this blog we will take care of that problem.
Step 2 — Upload evidence for analysis
Now that we have a Splunk instance running we can transfer evidence to the machine for further analysis. In most of the incident response cases we see, we acquire or receive data from the client and manually transfer it into our analysis environment. Let’s assume we have a local directory with evidence containing some Windows Event Log files (.evtx) files that we want to analyse. To get the logs into Splunk you need to follow the below steps:
- Install the Google Cloud CLI environment on your local system, you can follow the official documentation from Google.
- Create a Cloud Storage bucket or identify an existing bucket that you want to use to transfer files. In the example below we’ve created a bucket with the name blog_evidence. Important you have to add your project id and geographical location of the storage bucket.
gsutil mb -p insert_project_id -l insert_location -b on gs://blog_evidence
- Next from your workstation, upload the eventlog to the storage bucket.gsutil cp eventlog.evtx gs://blog_evidence
gsutil cp eventlog.evtx gs://blog_evidence
- Connect to your VM using RDP.
- On your VM, download files from the bucket. You can do this by opening the Google Cloud Shell SDK, from the shortcut on your desktop and use the following command to download the files to a local directory called ‘evidence’.
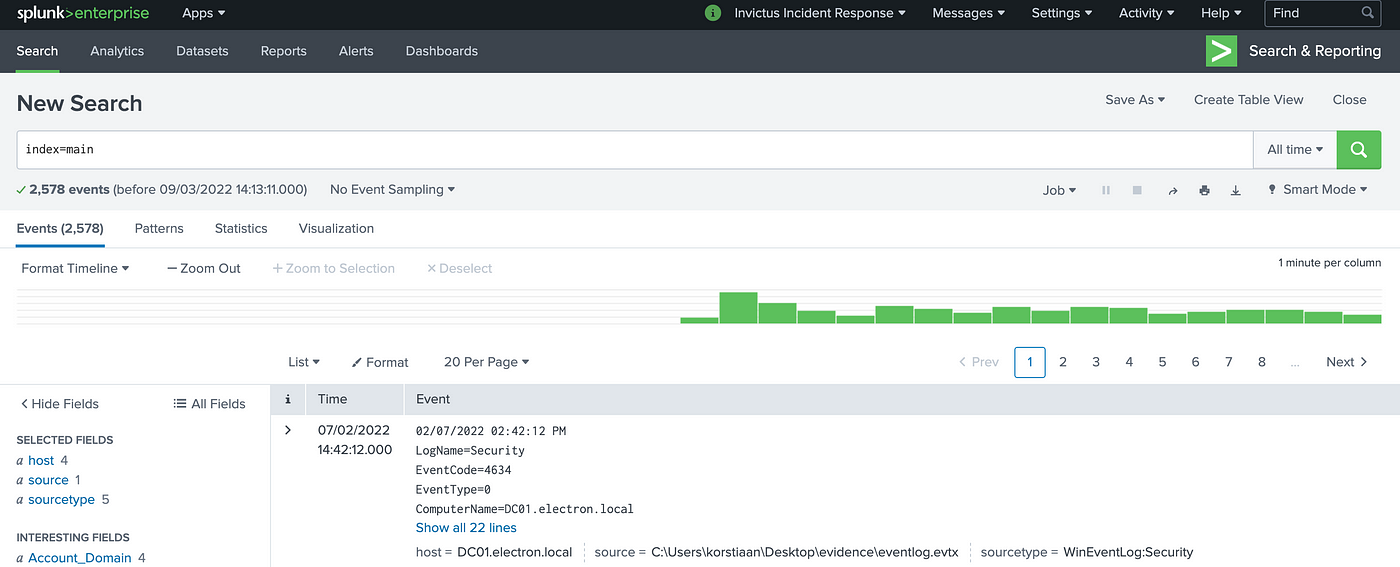
gsutil cp gs://blog_evidence/eventlog.evtx C:\Users\korstiaan\Desktop\evidence\
Alternatively you can use other methods for data transfer see the below table from Google’s documentation.

Another possibility it to use Google Storage Buckets/S3 buckets or setup a live connection to a system for data ingestion. If this is interesting for you, please let us know and we might write a new blog on that topic.
Last but not least we create an inputs file in Splunk that points to the evidence directory and grabs all the .evtx files. An example config is shown below:
[monitor://C:\Users\korstiaan\Desktop\evidence\*.evtx]index=mainsourcetype=preprocess-winevt
Now we have the logs in our Splunk cloud instance and can start our analysis.
You can stop here if this is enough for you, but we suggest securing your traffic and environment a bit further by adding in a certificate and running it on a custom domain.
Step 3 — (Optional) Setup SSL on a custom domain name
To get your own certificate and point your newly created Splunk environment to a custom domain, we need to perform a few additional steps:
- Install A record on Google domains (or where you host your domain)
- Install Letsencrypt on the Splunk instance
- Configure Splunk with the new certificate
Install A record
In the first step we need to setup an A record on your DNS server to point your public IP-address from your Splunk machine to a hostname. In this example Google Domains was used for the configuration.
- Go to domains.google.com select your domain and in the menu select DNS
- Select Manage custom records after setting the hostname make sure the Type is set to A and add in the public IP of your Splunk instance and hit Save.
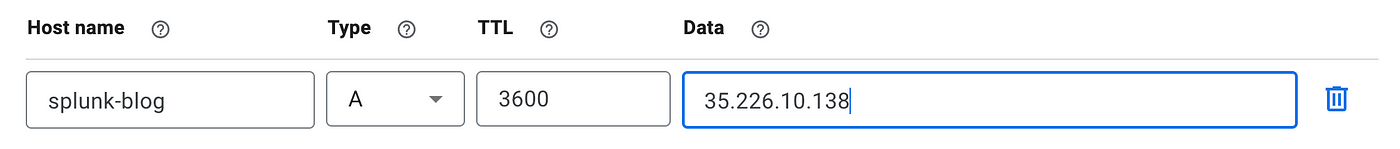
- Now you can use the hostname splunk-blog.invivctus-ir.com to access your Splunk instance.
Install and configure Letsencrypt on your Splunk machine
Next it’s time to move over to our Splunk server and download Letsencrypt for Windows. The tool that will help us automatically generate and renew certificates is Certbot and we can download it from GitHub.
After installing Certbot with the default configuration open up an elevate command prompt and run the following command:
certbot certonly — standalone -d splunk-blog.invictus-ir.com
Change the domain to match your custom domain that you created in your DNS.
Configure Splunk with the new certificate
With the newly created certificate we need to copy the certificate and private key and point Splunk to those files.
- Create a new directory to store the files
mkdir “C:\Program Files\Splunk\etc\auth\splunk-blog”
- Copy the certificate and private key from the Certbot directory to the new directory.
copy C:\Certbot\live\splunk-blog.invictus-ir.com\fullchain.pem “C:\Program Files\Splunk\etc\auth\splunk-blog\”
copy C:\Certbot\live\splunk-blog.invictus-ir.com\privkey.pem “C:\Program Files\Splunk\etc\auth\splunk-blog\”
- Next we configure Splunk to use these files, create the following file in “C:\Program Files\Splunk\etc\system\local\web.conf”
- Add the following information to the web.conf file
[settings]
enableSplunkWebSSL = 1
privKeyPath = C:\Program Files\Splunk\etc\auth\splunk-blog/privkey.pem
caCertPath = C:\Program Files\Splunk\etc\auth\splunk-blog/fullchain.pem
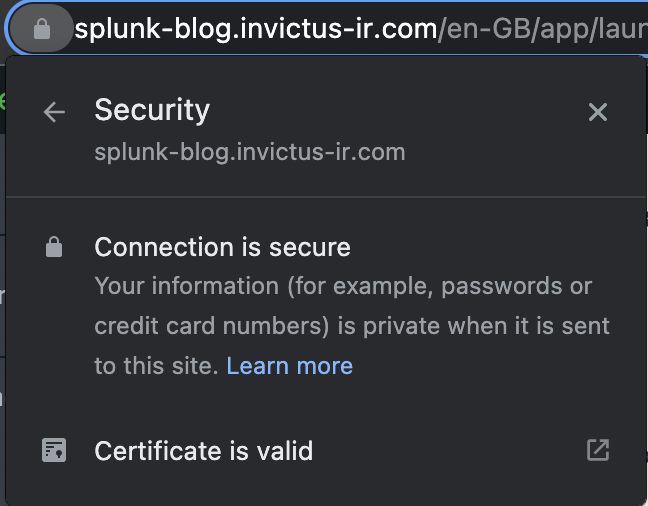
- Restart Splunk and look at this…
Conclusion
We hope you find this useful and before you start to scream, but what about Docker!! Working with Docker and external file locations containing evidence can be a pain. Also if you want to run it on a more continuous base a virtual server might be more suitable. Not too mention that with this setup you can easily add more resources to increase performance.